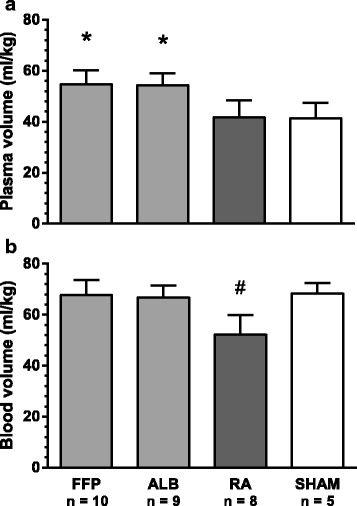
Fig. 3.

Plasma (a) and blood (b) volumes in resuscitated and sham animals at the end of the experiment. Data were analysed with one-way ANOVA followed by post hoc testing using the Newman-Keuls correction. Values are means ± SD. FFP fresh frozen plasma, ALB albumin, RA Ringer’s acetate, *significant difference compared to RA and SHAM, #significant difference compared to FFP, ALB and SHAM, P < 0.05
