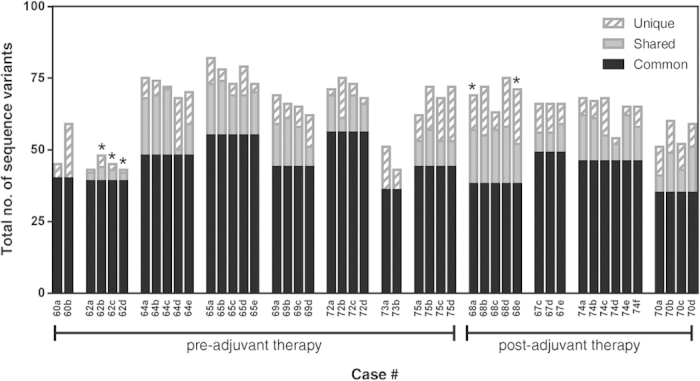
Figure 3. Next generation sequencing of MMR and BER genes identifies intratumoral heterogeneity at the DNA level.

Targeted next generation exome sequencing results for 6 genes (APEX1, PARP1, MSH2, MSH6, MLH2, PMS2) performed on the Illumina Miseq platform and analyzed with Avadis NGS software. The total number of sequence variants identified for all the genes in each specimen are graphed, and specimens are grouped by case. ‘Common’ variants (those present in all specimens from a case) are illustrated in solid black bars; ‘Shared’ variants (those present in more than one but not all specimens/case) are illustrated in solid grey bars and ‘unique’ variants (those present only in one specimen/case) are illustrated in diagonal grey stripped bars. Specimens with MGMT promoter methylation are indicated with an asterisk (*).
