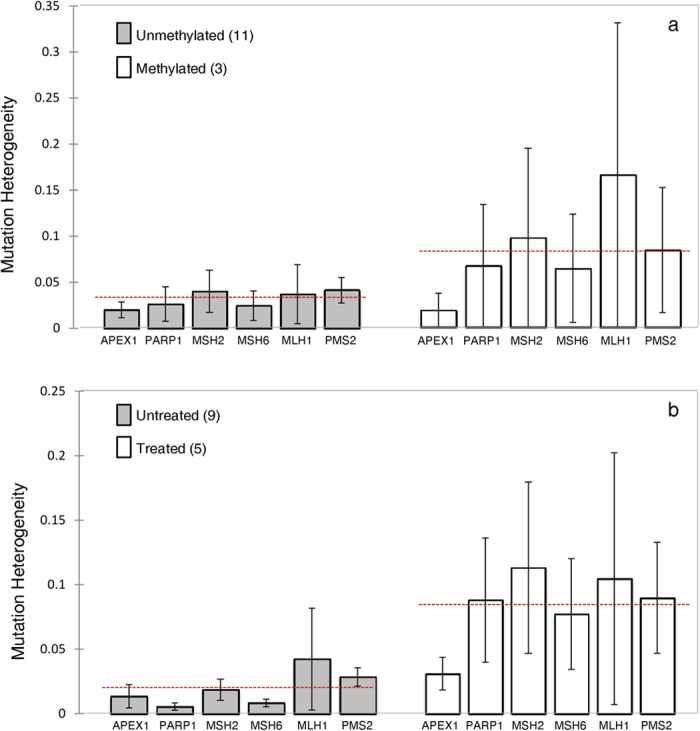
Figure 4. Sequence heterogeneity of BER and MMR genes.

Sequence heterogeneity was calculated for each BER (APEX1 and PARP1) and MMR (MSH6, MSH2, MLH1 and PMS2) gene for each biopsy as described in the methods. Samples were then stratified by MGMT promoter methylation (a) or treatment status (b). The red dotted line indicates the mean sequence heterogeneity of the samples. For cases in which MGMT promoter methylation heterogeneity was identified, case 62 was included in the methylated group with biopsy 62a being excluded from the analysis (as this single biopsy was determined to be unmethylated), and case 68 was included in the unmethylated group with biopsies 68a and 68e also being excluded (as they were determined to be methylated).
