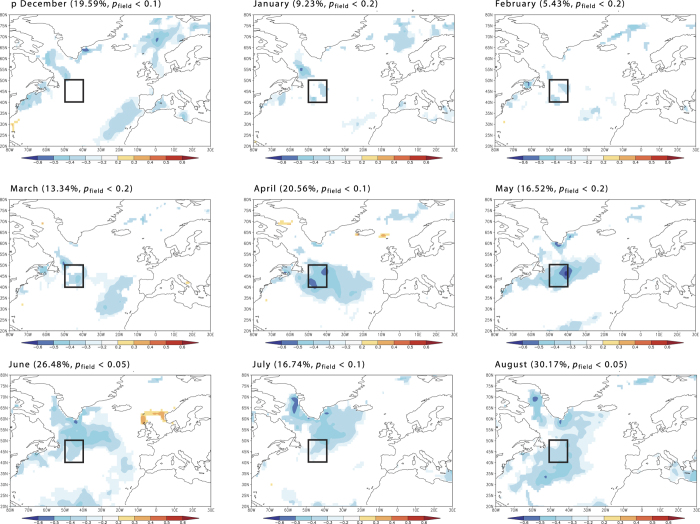
Figure 2. Correlation between annually burned forest area in Northern Sweden (north of 60° N) and monthly distribution of SSTs in the northern North Atlantic prior to and during the fire season.
The area with the higher correlation (40–50°N, 50–40°W) is indicated by a square on all maps. Coefficients significant at p < 0.1 are marked by colour. Colour scale refers to the values of correlation coefficient. See Fig. SI 1C for the maps of significance levels.

