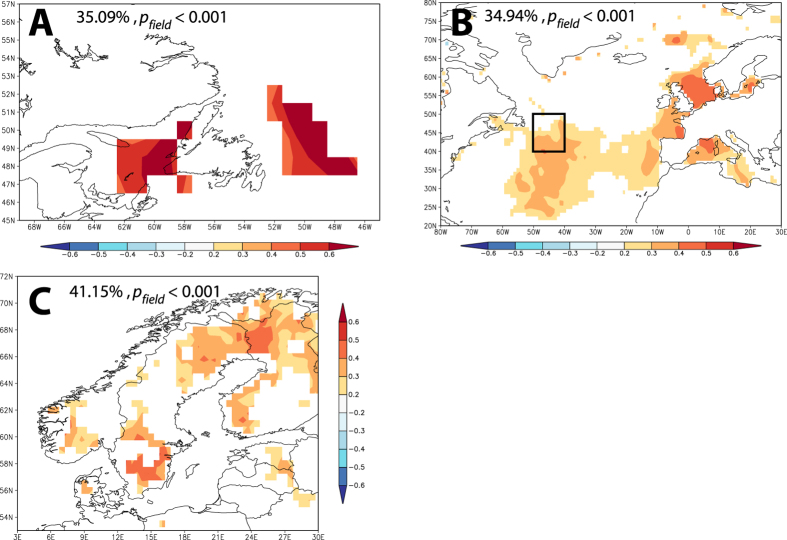
Figure 3. Teleconnection between the northern North Atlantic and fire weather in Scandinavia.
(A) Correlation between annually burned area in northern Sweden and sea ice concentration (NSIDC dataset) around Newfoundland for February through April for the period 1996–2014. (B) Correlation between average April-May SST of the northern North Atlantic for the period 1870–2010 and self-calibrated PDSI for the area of northern Sweden (a region limited by 60–64 °N and 4–14 °E) for July,August. The area limited by 40–50°N and 50–40°W is indicated by a square. Note that lower PDSI values mean increased drought conditions. (C) Correlation between self-calibrated average July,August PDSI for the area of northern Fennoscandia and average April,May SST for area limited by 40 to 50°N and 50 to 40°W. In all graphs coefficients significant at p < 0.1 are marked by colour. Colour scale refers to the values of the correlation coefficients. The field significance and the fraction of the map with significant correlations (p < 0.05), are shown for each map. See Fig. SI 1D for the maps of significance levels.

