


Figure 2. hTau transcript levels.
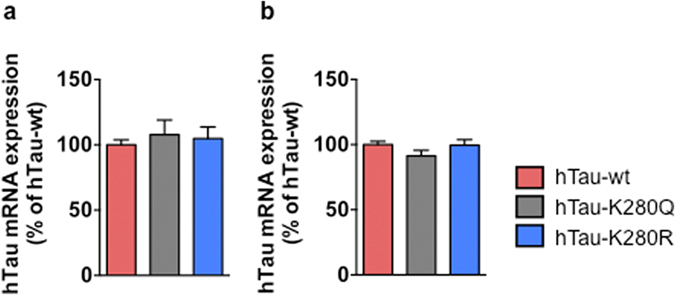
qRT-PCR analysis of hTau mRNA levels in heads of hTau-wt- (red), hTau-K280Q- (grey) and hTau-K280R- (blue) expressing transgenic flies following one (a) and five days (b) of induction in the adult nervous system (elavGS driver) showed no significant difference among the transgenic lines. p > 0.05, one-way ANOVA, n = 5–6/genotype.