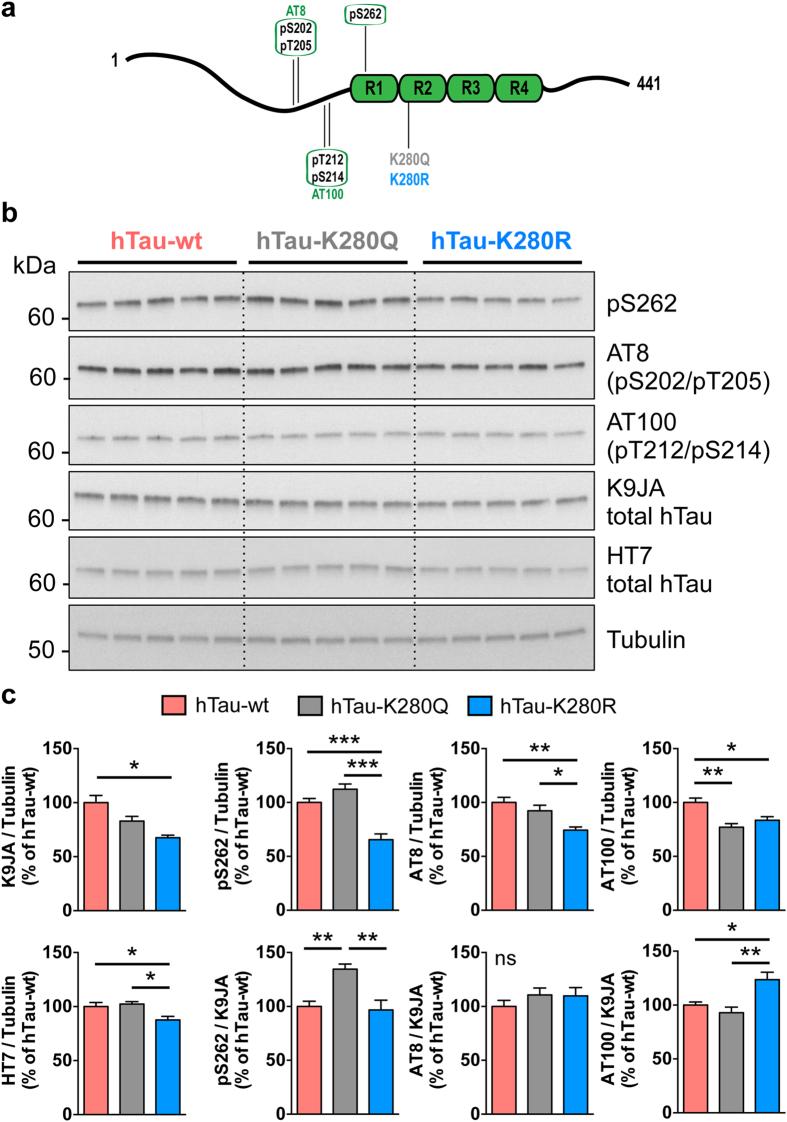
Figure 4. Pseudo-acetylation at K280 influenced the phosphorylation pattern of hTau proteins.
(a) Illustration of hTau phosphorylation and acetylation sites used in this study. hTau phosphorylation on S262, S202/T205 (AT8) and T212/S214 (AT100) was analysed following pseudo-acetylation or pseudo-deacetylation of hTau at K280 (K280Q and K280R, respectively). (b,c) Western blot analysis (b) and quantification (c) of hTau phosphorylation on S262, S202/T205 (AT8) and T212/S214 (AT100) and total hTau levels using the polyclonal K9JA (Dako) and monoclonal HT7 antibodies, following 14 days of hTau expression in the fly nervous system using the elavGS driver. Results are normalised to both Tubulin and total hTau levels and are expressed relative to levels observed in the hTau-wt transgenic line (*p < 0.05, **p < 0.01 and ***p < 0.001, one-way ANOVA followed by Tukey’s post hoc test, n = 5/genotype).

