
Figure 8. Mutating K280 to a pseudo-acetylated or pseudo-unacetylated state both equally delayed fly death.
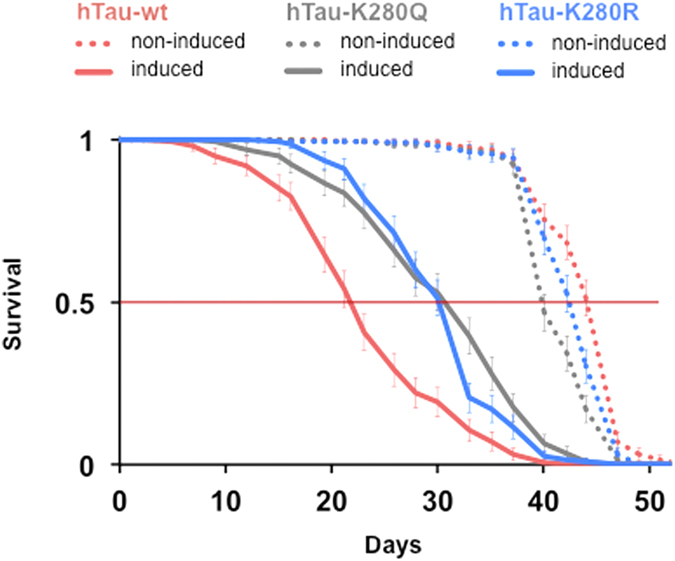
Representative survival curves of transgenic fly lines expressing (plain curves) either hTau-wt (red), hTau-K280Q (grey) or hTau-K280R (blue) in the adult fly nervous system (elavGS driver and RU486 induction). Survival of non-induced lines is shown as colour-matched dotted curves.