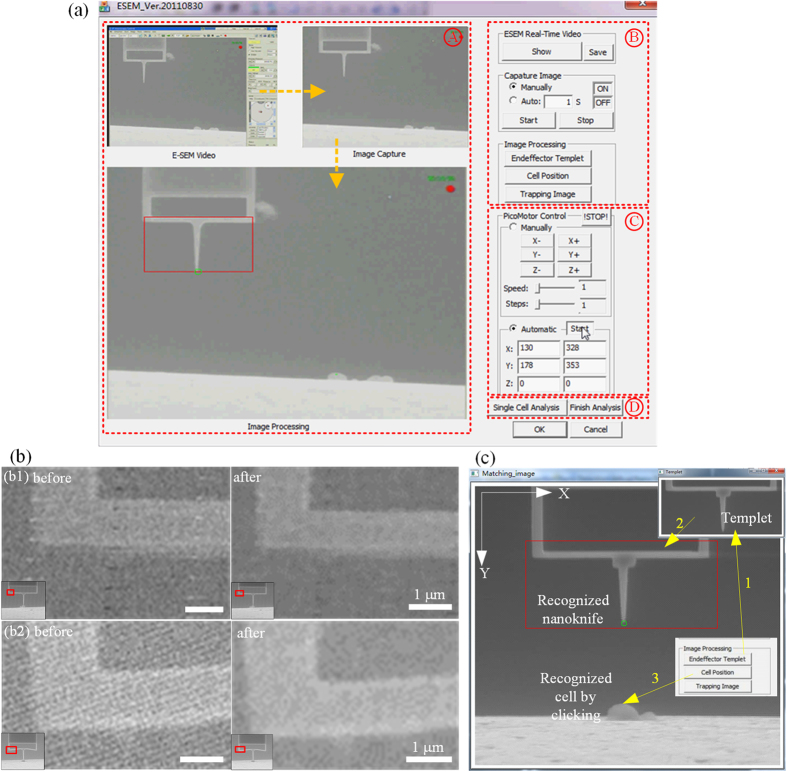
Figure 8.
(a) Human-machine interface. Region A is for the real-time video monitoring; Region B is for the imaging processing; Region C is for the nanorobot control, and Region D is for the cell analysis, respectively. (b) Images comparison between before and after image filtering. (b1,b2) are two examples during the cell cutting experiment: the left images are the original images and the right images are the ones after filtering. The left-bottom window in each picture shows the overall images. (c) Illustration of the object recognition. The nanoknife is recognized by template matching. The cell is recognized by single clicking on the human-machine interface. In the developed software, the horizontal and vertical direction is defined as X axis and Y axis, respectively.

