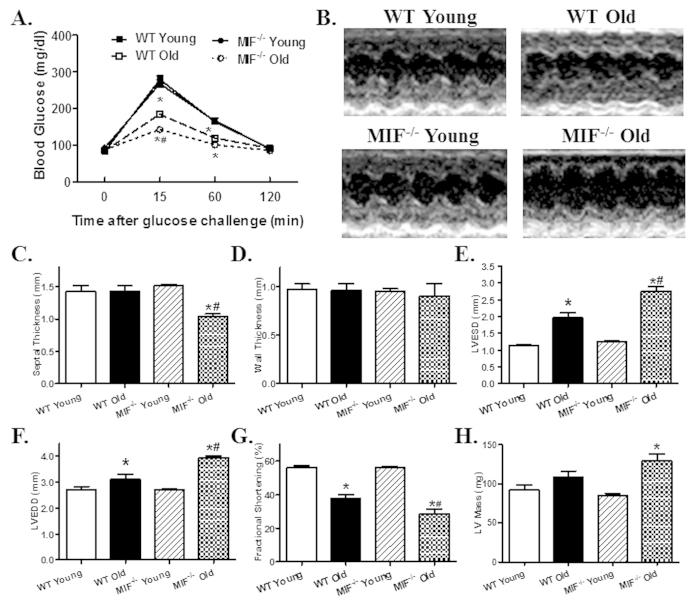
Figure 1. Intraperitoneal glucose tolerance test (IPGTT) and echocardiographic properties in young or old WT and MIF−/− mice.
(A) IPGTT (2 g/kg glucose challenge, i.p.) curve depicting glucose clearance capacity; (B) Representative M-mode echocardiographic images in hearts from young or old WT and MIF−/− mice; (C) Septal thickness; (D) LV Wall thickness; (E) LV end systolic diameter (LVESD); (F) LV end diastolic diameter (LVEDD); (G) Fractional shortening; and H: LV mass. Mean ± SEM, n = 6 (panel A), 7–9 mice (Panel C–H) per group, *p < 0.05 vs. WT young group, #p < 0.05 vs. WT old group.

