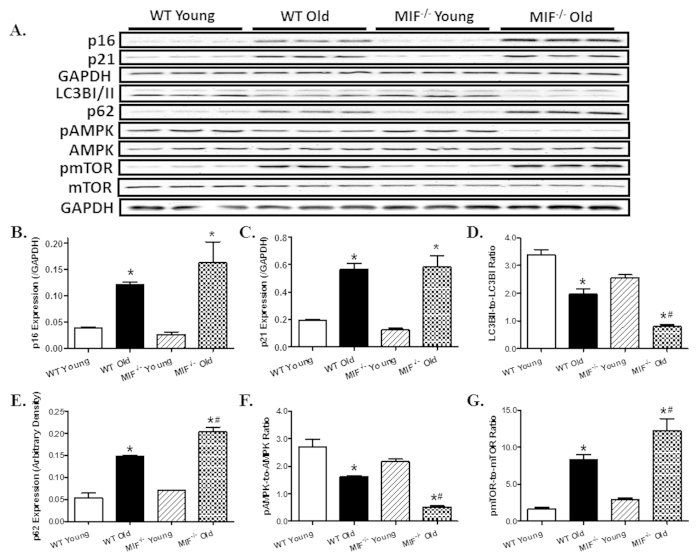
Figure 5. Effect of MIF deficiency on aging-induced changes in senescence marker, autophagy and autophagy regulatory molecules.
(A) Representative gel blots depicting levels of the senescence markers p16 and p21, the autophagy markers LC3B and p62; pan and phosphorylated AMPK and mTOR using specific antibodies (GAPDH was used as loading control); (B) p16 expression; (C) p21 expression; (D) LC3BI/II expression (LC3BII-to-LC3BI ratio); (E) p62 expression; (F) pAMPK-to-AMPK ratio; and (G) pmTOR-to-mTOR ratio. Mean ± SEM, n = 3–4 mice per group, *p < 0.05 vs. WT young group, #p < 0.05 vs. WT old group.

