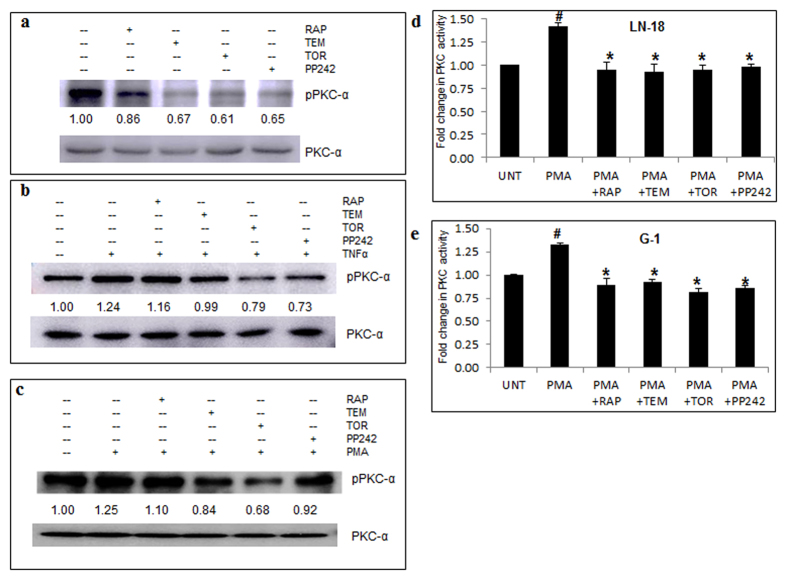
Figure 7. mTOR inhibitors lower PKC-α activity.
Protein levels of phospho PKC-α and total PKC-α were measured by immunoblotting of total cell lysates of LN-18 cells treated with rapamycin-RAP (10 μM), temisirolimus-TEM (5 μM), torin-TOR (100 nM), PP-242 (100 nM) for 24 h alone and in combination with TNFα (10 ng/ml) for 12 h or PMA (100 ng/ml) for 24 h before termination of time point. Representative cropped images of three independent experiments of treatments (a) inhibitors alone (b) TNFα in combination with inhibitors (c) PMA in combination with inhibitors. Images show fold change of treated phospho PKC-α protein expression (normalised with respect to total PKC-α) relative to untreated samples obtained by densitometry through ImageJ analysis. Full length blots are included in supplementary Fig. S13. PKC Kinase activity assay was performed on whole cell lysates from cells treated with RAP (10 μM), TEM (5 μM), TOR (100 nM), PP-242 (100 nM) for 24 h in combination with PMA (100 ng/ml) of (d) LN-18 and (e) G-1 cells. The graphs represent fold change in PKC activity +/− SEM of two similar experiments performed in triplicates. #p-value < 0.05 Untreated vs. PMA treated; *p-value < 0.05 PMA treatment vs. PMA in combination with inhibitors.

