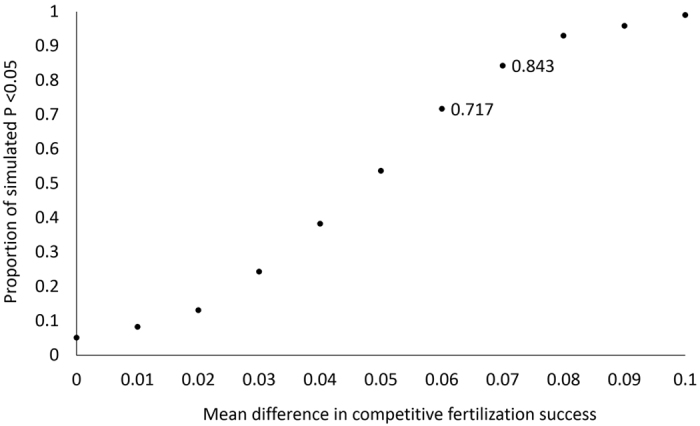
Figure 2. Proportion of significant simulated tests of varying differences in competitive fertilisation success between stained and unstained sperm (based on the variation and sample size in our dataset); i.e. power to detect a difference.

The horizontal axis shows the varying simulated differences in the probability of success due to staining, and the vertical axis shows the proportion of significant P values from 1000 simulated tests. A power of 0.8 falls between a difference of 0.06 and 0.07.
