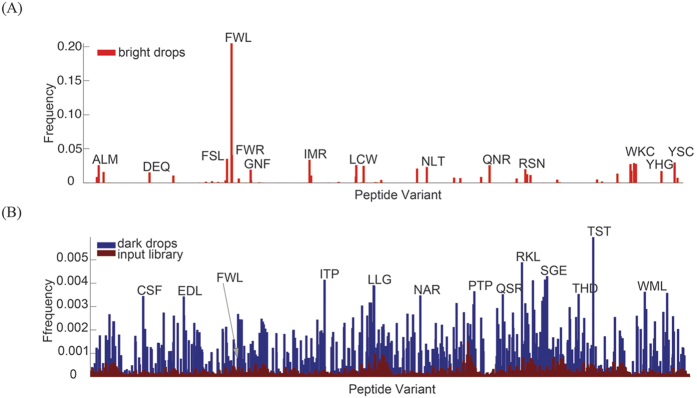
Figure 5. Frequency histogram representation of deep sequencing data from collected drops.
The relative frequencies of peptide sequences from bright drops are shown in red (A). The relative frequencies of peptide sequences from dark drops (blue) and input library (dark red) are shown in (B). The PMI and some frequent peptide variants are indicated by three-residue sequences, such as FWL, FSL and FWR, corresponding to the randomized positions within the peptide sequence. The PMI sequence is FWL.

