
Figure 6. Flow cytometry analysis of antibody binding to N. gonorrhoeae.
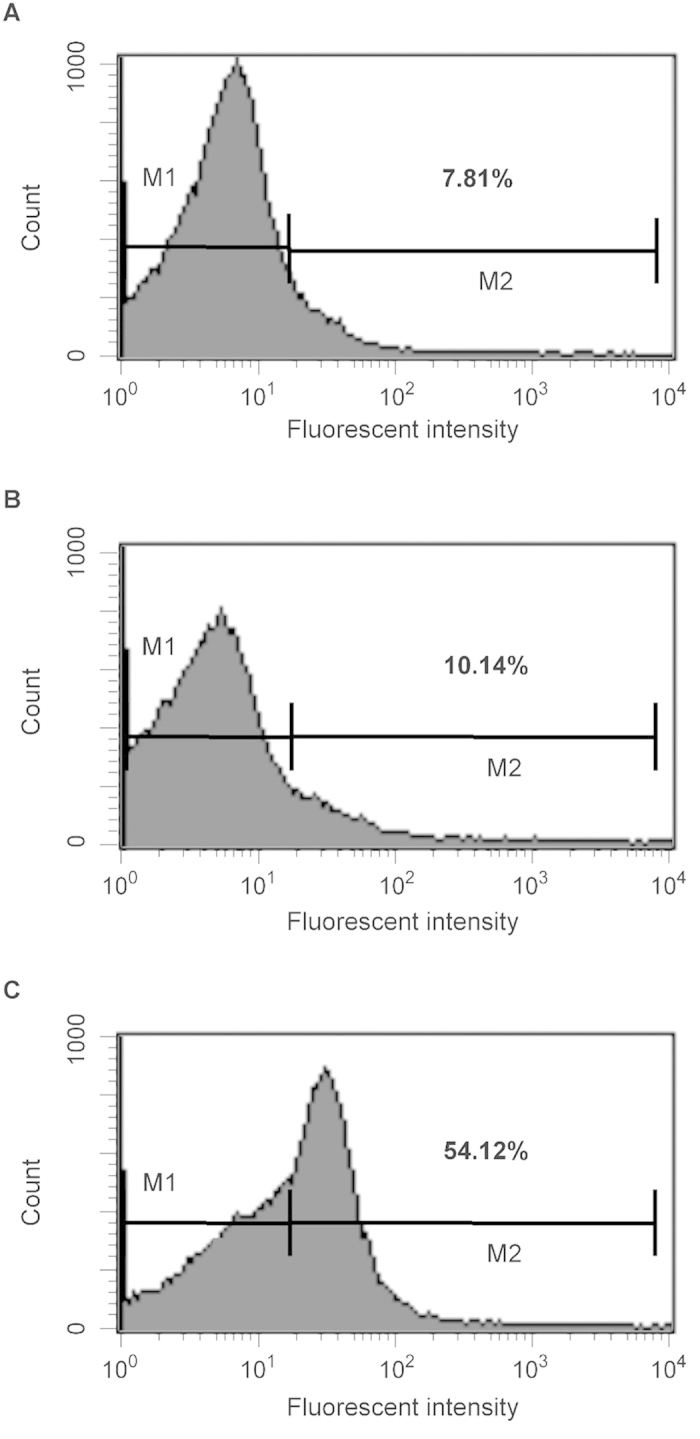
FA1090 cells were treated with buffer (panel A) pre-immunization sera (dilution 1:500) (panel B) or immunized sera (dilution 1:500) obtained after 66 day (panel C) followed by treatment with Cy3 goat anti-rabbit IgG (Life Technologies). The bacteria were analyzed by using FACS Calibur flow cytometer. Data were analyzed with CellQuest. Shown are representative histograms from three independent experiments. The bar in the figure represents the gate used to measure binding efficiency. The number in each figure corresponds to the percentage of the population that bound antibody.