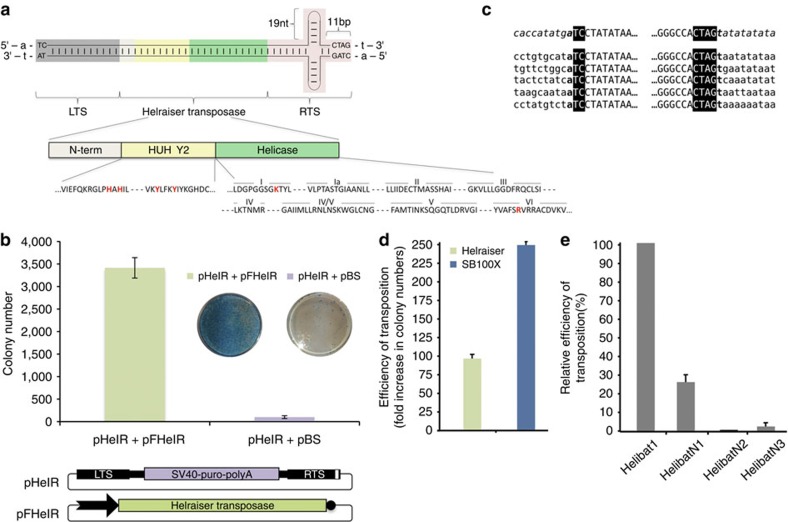
Figure 1. Features of Helraiser transposition in human HeLa cells.
(a) Schematic representation of the Helraiser transposon. LTS and RTS terminal sequences are in uppercase, and flanking A and T host target site sequences are in lowercase. White, yellow and green rectangles represent N-terminal, endonuclease and helicase domains of the Helraiser transposase, respectively. Conserved amino-acid motifs are shown below. Positions of the residues used for mutagenesis are shown in red. (b) Helraiser colony-forming efficiency. Shown are tissue culture plates containing stained puro-resistant HeLa cell colonies. Helraiser donor (pHelR) and helper (pFHelR) plasmids. White rectangle in RTS: hairpin; black arrow: promoter driving transposase expression, black circle: polyA signal; these annotations are used consistently in all the figures. Data are represented as mean±s.e.m., n=7 biological replicates. (c) Helraiser transposition generates canonical insertions. Helraiser LTS- or RTS-to-genome juctions are shown for 10 independent transposon insertions. Helraiser sequence is shown in uppercase with the conserved 5′- and 3′-terminal sequences in a black blackground and flanking host genomic sequence is in lowercase. The flanking pHelR plasmid sequence (upper line) is in italic. (d) Relative transposition efficiencies of Helraiser and Sleeping Beauty measured by colony formation in HeLa cells. Data are represented as mean±s.e.m., n=3 biological replicates. (e) Relative transposition efficiencies of Helibat1 and the non-autonomous subfamilies HelibatN1, HelibatN2 and HelibatN3. Data are represented as mean±s.e.m., n=5 biological replicates.

