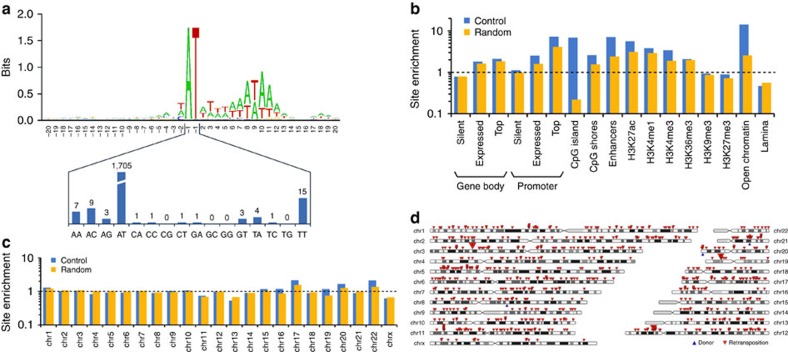
Figure 5. Genome-wide analysis of de novo Helraiser insertions in the human genome.
(a) The sequence logo was created with WebLogo (http://weblogo.berkeley.edu). Transposon integrations are between the positions −1 and 1. The lower panel shows the distribution of dinucleotides at the integration sites. (b) Fold enrichment of relative integration frequencies compared with random genomic sites (yellow) and control sites imitating the base composition characteristics of Helraiser integration sites (blue). Top genes are the 500 genes with highest expression level. Integration frequencies into promoter regions of silent genes and H3K9me3 regions were not significantly different from controls; all other differences were statistically significant (Fisher's exact test P value ≤0.05). (c) Fold enrichment of relative integration frequencies per chromosome compared with random genomic sites (yellow) and control sites imitating the base composition characteristics of Helraiser integration sites (blue). (d) Chromosomal distribution of 701 Helraiser retransposition events (red arrows). Blue arrows represent the positions of the original chromosomal donor sites.

