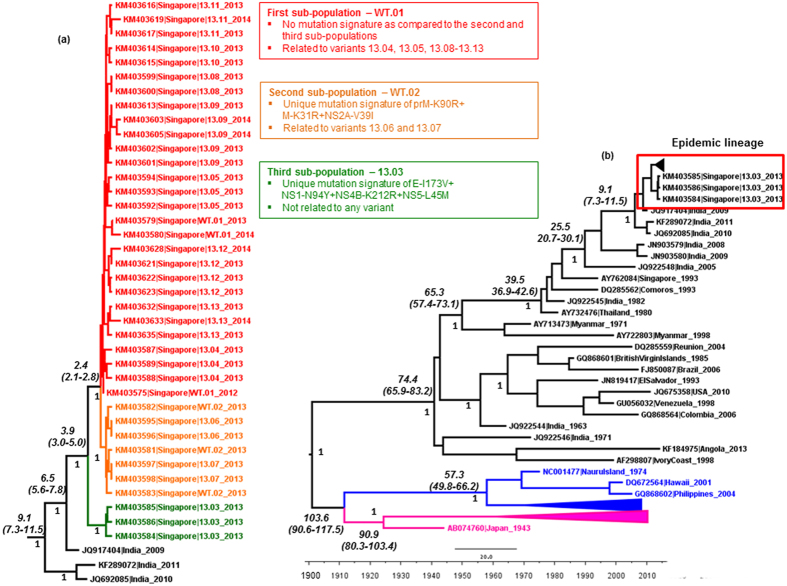
Figure 1. Phylogenetic and tMRCA analysis of the epidemic lineage and DENV-1 genotypes.
The maximum clade credibility tree was constructed using the Bayesian Markov Chain Monte Carlo (MCMC) method implemented in the BEAST package v1.7.451,52. The analysis included 38 complete polyprotein sequences generated during this study and 44 sequences retrieved from GenBank database. Only a subset of complete poplyprotein sequences representative of each variant was included in the phylogeny to make the tree concise. (a). The analysis of epidemic lineage. The first and second sub-populations of wild-type isolates ancestral to variants 13.04–13.13 are indicated with taxa name WT.01 and WT.02 respectively. The figure demonstrates the genetic relatedness of each variant to the first (red), second (orange) and third (green) sub-populations. (b). Phylogeny and tMRCA analysis of DENV genotypes. Genotypes I, II and III are shown in purple, blue and black respectively. The epidemic lineage is shown in the red box. Numbers shown on branches are posterior probability values (non-italics) of major nodes and tMRCA values in years (italics). The 95% HPD values are shown within brackets. All sequences are named with accession number, country of origin and year of isolation. In addition, the taxon names of study isolates include the variant identity.

