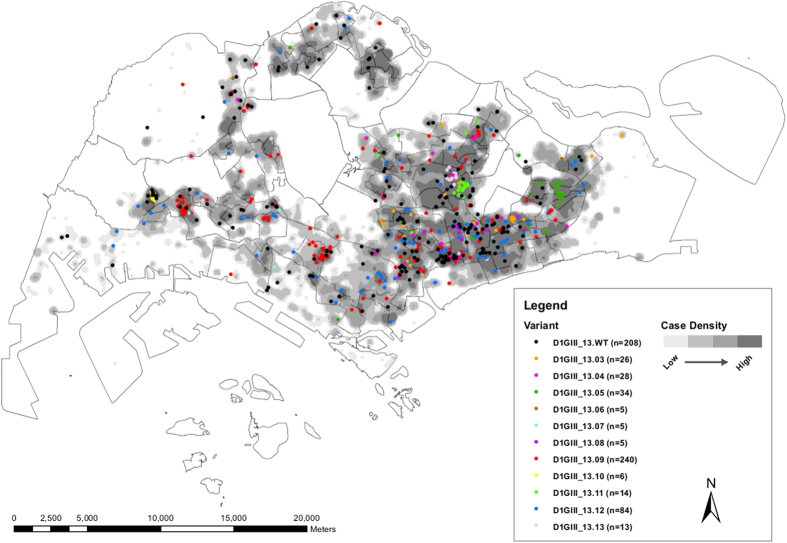
Figure 4. Geospatial distribution of variants of the epidemic lineage.
The coordinates of reported locations available on 668 genotyped strains of epidemic lineage detected from November 2012 to end of May 2014 were mapped using the ArcGIS 10.1 ArcMap software (http://www.esri.com/software/arcgis/arcgis10/; ESRI, CA, USA). Each variant is colour-coded as shown in the figure legend. Shaded areas represent the distribution of dengue cases in a density gradient as indicated in the legend. Case density was calculated using the Kernel Density Tool in ArcGIS 10.1 ArcMap software (ESRI, CA, USA). Density values were classified into four classes, namely below 25th (low in lightest tone), 26th–50th, 51st–75th and more than 75th (high in darkest tone) quantiles, using the quantile classification method. n = number of cases per variant used in the analysis.

