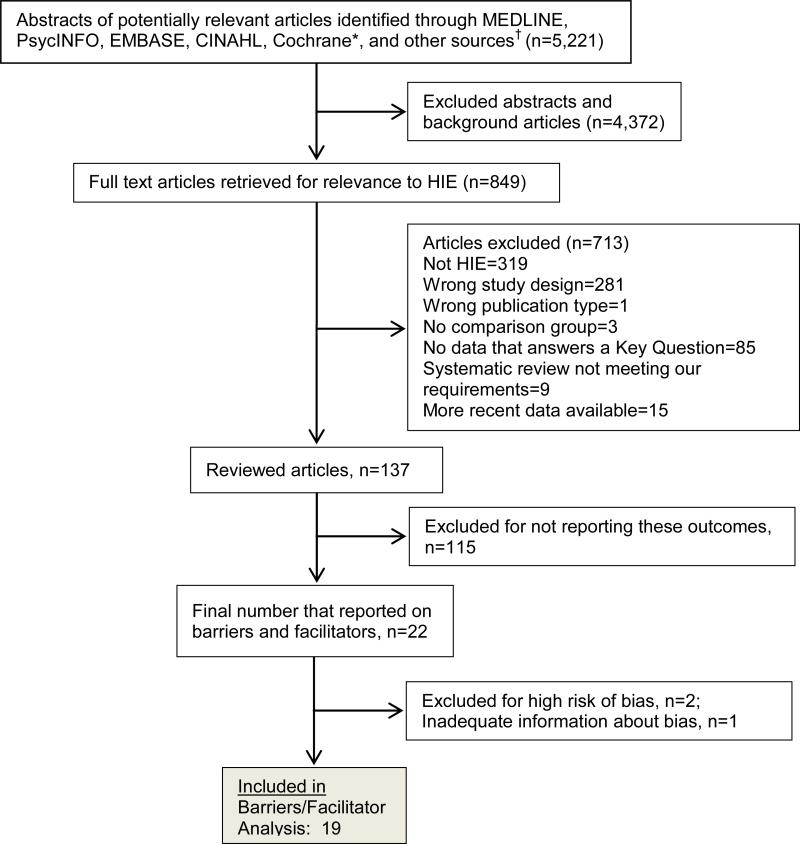
Figure 1. Literature Flow Diagram.
Description: This figure depicts the number of abstracts found and reviewed for inclusion; full-text articles reviewed and the number of articles included for the whole report and the included articles focused on barriers and facilitators to use (n=19).
*Cochrane databases include the Cochrane Database of Systematic Reviews, Cochrane Central Register of Controlled Trials, Database of Abstracts of Reviews of Effects, and National Health Sciences Economic Evaluation Database.
†Identified from reference lists, hand searching, suggested by experts, and other sources.

