Figure 1.

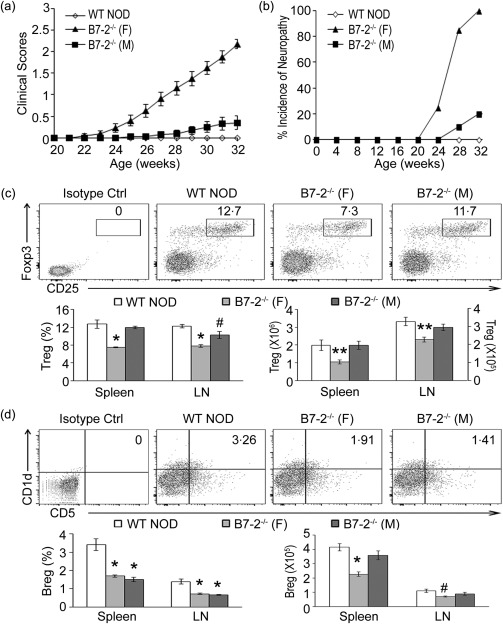
Lower frequency and number of regulatory T cells (Tregs) and regulatory B cells (Bregs) in female B7‐2–/– non‐obese diabetic (NOD) mice compared to wild‐type (WT) NOD mice. (a,b) Clinical severity and incidence of spontaneous autoimmune polyneuropathy (SAP) in female versus male B7‐2–/– NOD mice (n = 20 for each group). (c). Examples of scatterplots showing decreased percentage of splenic CD4+ Treg [CD25+forkhead box protein 3 (FoxP3)+/CD4+ T cells] in 8‐month‐old female B7‐2–/– NOD mice but not in male B7‐2–/– NOD mice. Total splenocytes or lymph node (LN) cells were gated on lymphocytes, followed by gating on CD4, and subsequent analysis for CD25 and FoxP3 expression. Lower panel: bar graphs indicate mean ± standard error of the mean (s.e.m.) percentage and number of CD4+ Tregs in spleen and LN. *P < 0·0005, #P < 0·03; **P <0·01 (n = 6). (d) Examples of scatterplots showing decreased percentage of splenic Bregs (CD1dhiCD5+/CD19+ B cells) in both female and male B7‐2‐–/– NOD mice (8 months). Total splenocytes or LN cells were gated on lymphocytes, followed by gating on CD19 and subsequent analysis of CD1d and CD5 expression. Lower panel: bar graphs indicate mean ± s.e.m. percentage and number of Bregs in spleen and LN. *P < 0·002; #P < 0·02 (n = 8–9 for %Breg, and n = 3–4 for Breg number).
