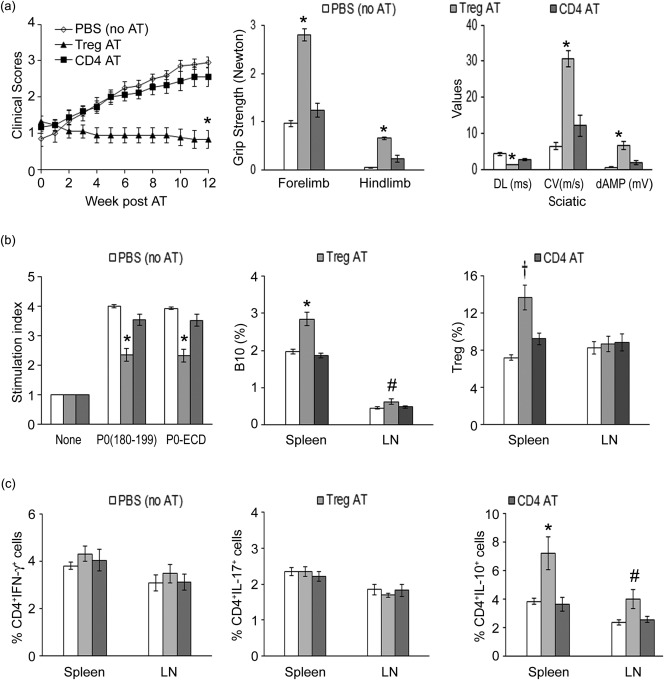
Figure 3.

Suppression of spontaneous autoimmune polyneuropathy (SAP) by adoptive transfer (AT) of wild‐type CD4+ regulatory T cells (Treg) into symptomatic B7‐2–/– non‐obese diabetic mice (NOD) mice. (a) Clinical severity. CD4+ enhanced green fluorescent protein (eGFP+) (Treg) and CD4+eGFP– cells were sorted from splenocytes and LN cells of 2‐month‐old forkhead box protein 3 (FoxP3)‐eGFP‐Cre NOD mice at day 20 post‐immunization with P0 (200 μg). Recipient mice (6‐month‐old female B7‐2–/– NOD mice) were injected with 1 × 10⁶ sorted cells via tail vein. Comparing Treg (AT) versus CD4+eGFP– (AT) or phosphate‐buffered saline (PBS) (no AT), *P < 0·0002 (n = 9‐10) for clinical scores (left panel), grip strength measurements (middle panel) and all parameters of sciatic motor responses (right panel). DL = distal latency; CV = conduction velocity; dAMP = distal amplitude. Grip strength measurements and sciatic nerve electrophysiology were performed at 12 weeks post‐AT. (b) Splenocyte proliferation, B10 cells and Tregs at 12 weeks post‐AT. Left panel: splenocyte proliferation based on [3H]‐thymidine incorporation. (Antigen): 20 μg/ml; treatment duration: 72 h. *P < 0·0005 (n = 9–10) comparing Treg (AT) versus the other two groups. Middle panel: B10 cells. *P < 0·0005 for splenic B10 cells; #P < 0·05 for LN B10 cells (n = 6). Right panel: Tregs. †P < 0·008 (n = 6) for splenic Tregs. (c) T cell cytokine profile at 12 weeks post‐AT. Comparing Treg (AT) versus the other two groups, *P < 0·01 for splenic CD4+IL‐10+ cells and # P < 0·04 for LN CD4+IL‐10+ cells (n = 6).
