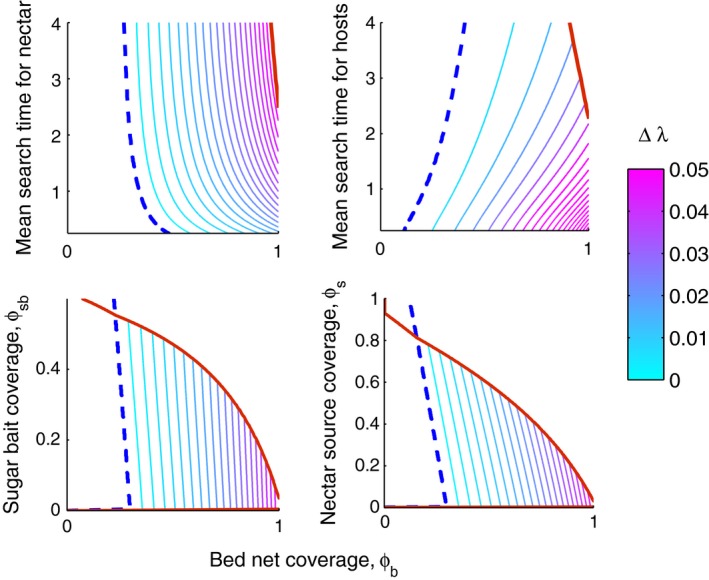
Figure 4.

Fitness differences between nocturnal and crepuscular foraging patterns as a function of bed net coverage (horizontal axis) and four other environmental parameters (vertical axes). In each panel, the dashed line shows where the fitnesses of the two patterns are equal. To the left (right) of the dashed line, the fitness of the nocturnal forager is greater (less) than that of the crepuscular forager. To the right of the red line, λ of both types is <1. The area between the dashed blue and solid red lines gives the parameter space where behavioral resistance is favored. Within this space, the colored contour lines indicate the difference between λ n and λ c. On their vertical axes, the panels show the effect of the expected searching time for nectar sources (in hours), 1/γs (upper left panel), the expected searching time for blood hosts (in hours), 1/γb (upper right panel); and sugar bait coverage (lower panels).
