
Figure 2.
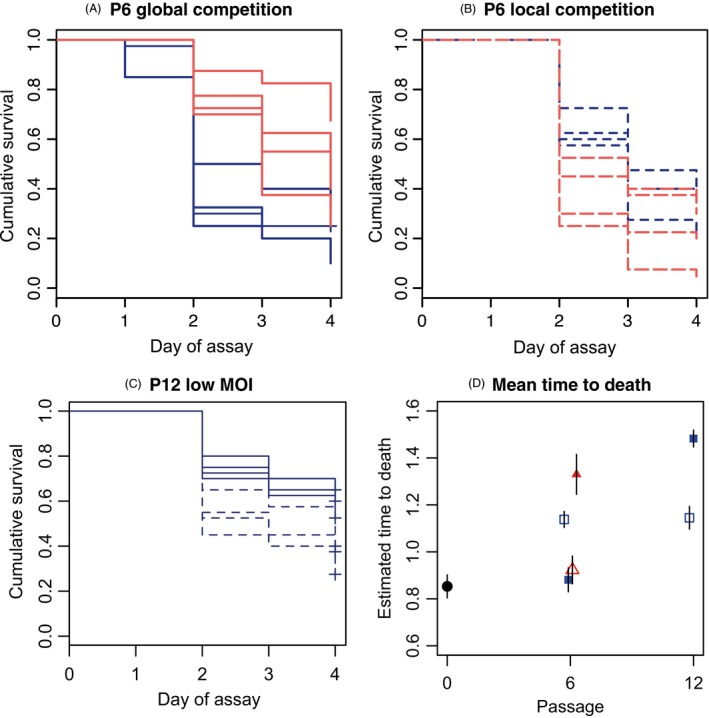
Variation in virulence over the course of the selection experiment. (A) Kaplan–Meier survivorship curves for passage 6 bioassays conducted with the eight lineages in the global competition treatment. (B) Kaplan–Meier survivorship curves for passage 6 bioassays conducted with the eight lineages in the local competition treatment. (C) Survivorship curves for the surviving low MOI lineages in passage 12. (D) Parameter estimates of time to death (±SE) in the baseline population (filled circle at P0) and all subsequent selection treatments. Red lines/red triangles represent the high MOI lineages, dark blue lines/squares high relatedness (low MOI) lineages, dashed lines and open symbols represent local competition and solid lines and filled symbols represent global competition.