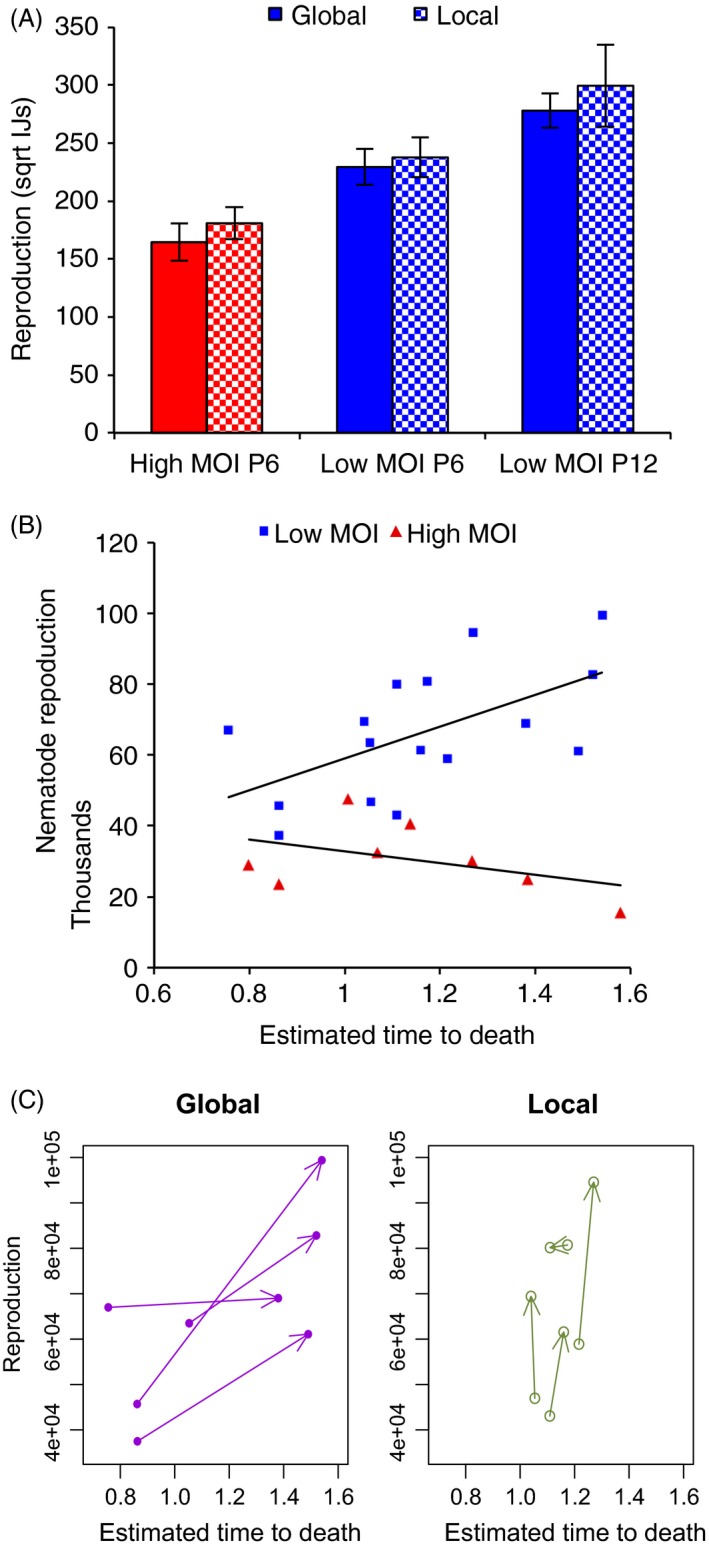
Figure 3.

(A) In vivo reproduction (lineage means ± SE, N = 4) of infective juveniles (IJs) produced from cadavers in after passage 6 and passage 12. Data are mean square root IJ count per host (±SE). (B) The relationship between in vivo reproduction and virulence for lineages assayed at passage 6 and passage 12. Reproduction data are untransformed IJ counts while time to death data are parameter estimates for each lineage calculated using log‐logistic survivorship models. Note that longer time to death indicates lower virulence. Red bars/red triangles represent the high MOI lineages, dark blue bars/squares high relatedness (low MOI) lineages, open bars represent local competition, and filled bars represent global competition. (C) The changing phenotypes of the low MOI lineages, the arrows lead from replicates assayed at passage 6 to the same lineage assayed at passage 12.
