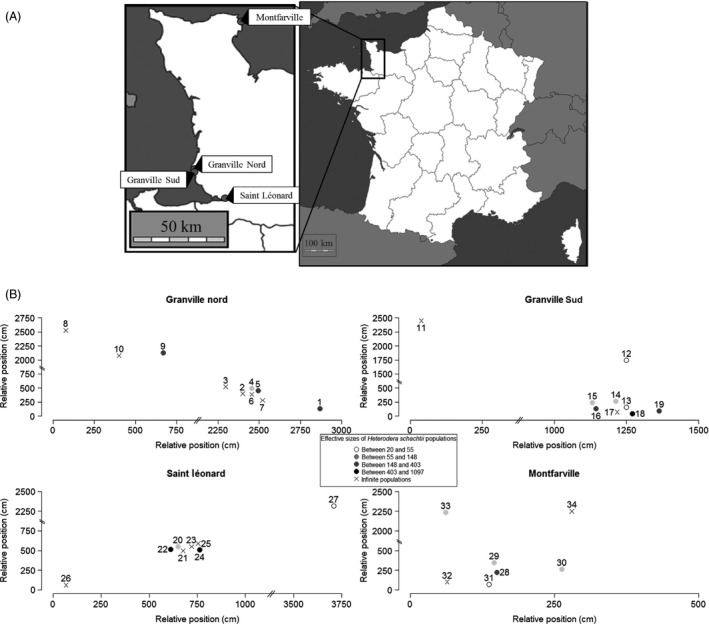
Figure 1.

(A) Beach locations and (B) relative locations of sampled populations in each beach. Symbols show effective sizes estimated with the pseudo‐likelihood method (see text). Effective population size classes (and the corresponding gray scale) were taken from Fig. 2.
