
Figure 4.
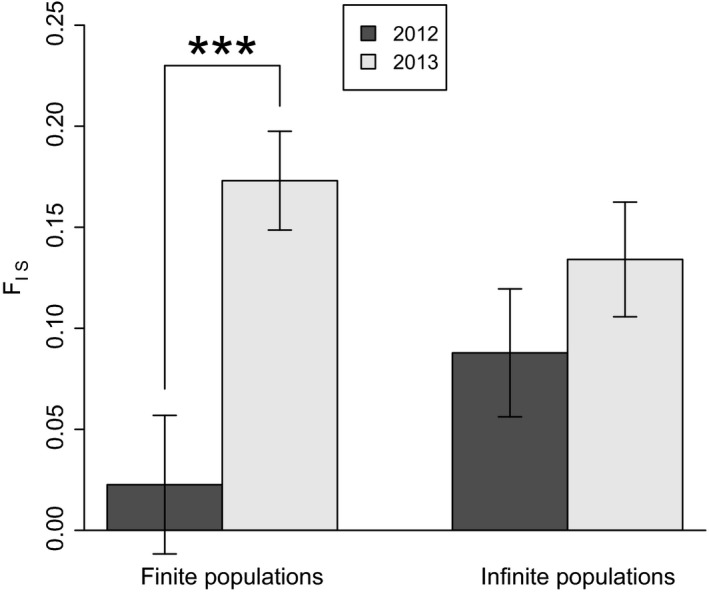
Variation of mean FIS of finite and infinite populations over time. Error bars represent standard error. ***: P < 0.001.
Official websites use .gov
A
.gov website belongs to an official
government organization in the United States.
Secure .gov websites use HTTPS
A lock (
) or https:// means you've safely
connected to the .gov website. Share sensitive
information only on official, secure websites.
Variation of mean FIS of finite and infinite populations over time. Error bars represent standard error. ***: P < 0.001.