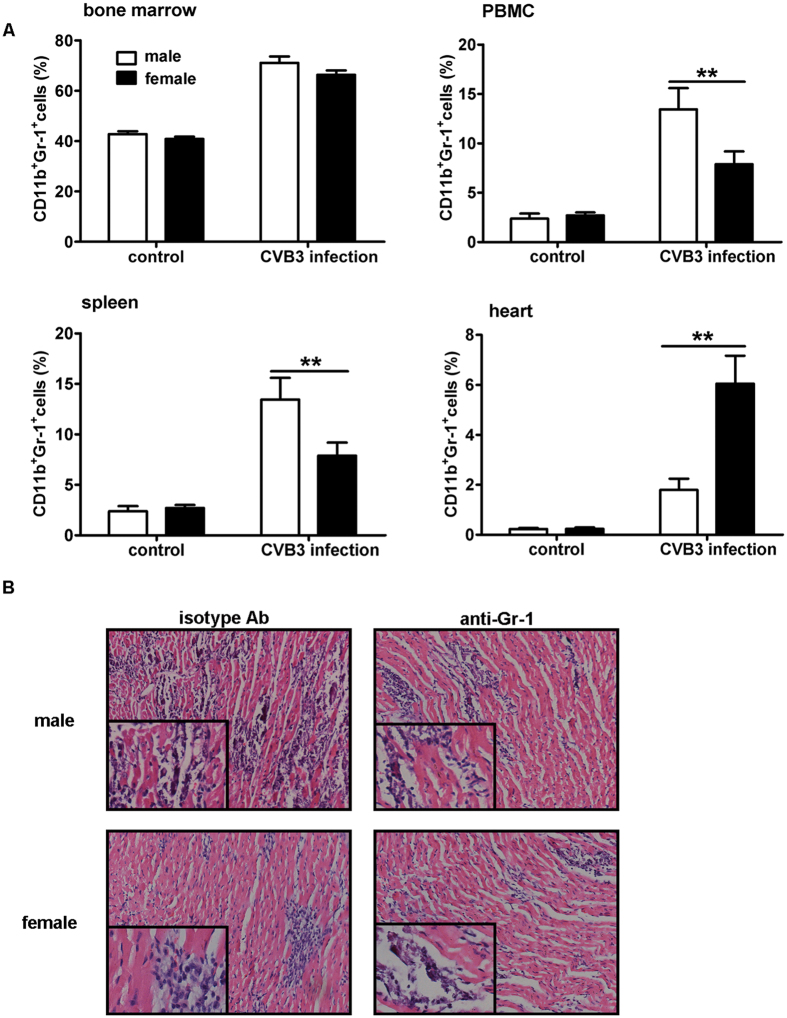
Figure 2. Frequency of MDSCs in CVB3-infected male and female mice.
(A) Seven days post CVB3 infection, frequencies of CD11b+Gr-1+ MDSCs in bone marrow, PBMC, spleen and heart tissues were measured in male and female mice by flow cytometry. Data were presented as the means ± SEM of 5 mice per group. (B) Myocardial histopathological alteration in infected mice receiving anti-Gr-1 antibody treatment. Individual experiment was conducted 3 times with similar results, and the representative data were shown. **p < 0.01.

