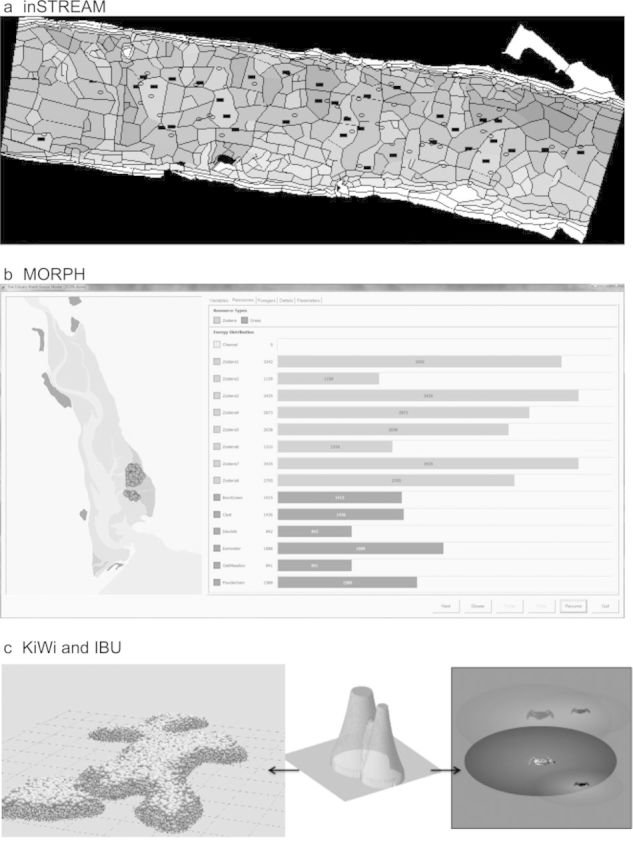
Figure 2.

Graphical output of individual-based models. (a) inSTREAM. Habitat cells are shaded by depth. Adult trout are depicted as black rectangles in the cells in which they feed; redds (egg nests) appear as ovals. Users can click on the display to view and even change state variables of individual cells, fish, and redds. (b) MORPH (here, simulating Brent geese [Branta bernicla L.] in the Exe Estuary, United Kingdom). The distribution of patches and foragers (circles) are displayed to the left (different types of forager can be represented in different colors). The tabs to the right display the values of state variables (here, food resources) graphically. The “Details” tab shows the numerical value of each global, patch, and forager state variable during each time step. Individual foragers can be selected by double clicking either in the display or on the “Details” tab; the forager can then be followed through the simulation. The buttons at the bottom right allow the simulation to be paused, slowed down, speeded up, or progressed one time step at a time. (c) KiWi (left; Piou et al. 2008) simulates mangrove forests, and IBU (right; Piou et al. 2007) simulates competition between crabs (Ucides cordatus). KiWi and IBU use the field-of-neighborhood concept as a standard way to model neighborhood interactions among sessile and nonsessile organisms (center; the height of the zone represents the strength of interaction).
