Figure 4.

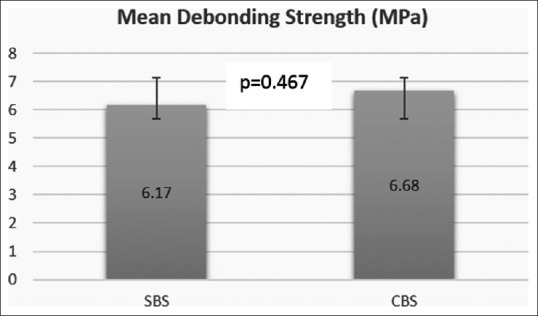
Mean and standard deviation of the debonding strength values (MPa) for the two groups assessed. Using independent sample t-test; no significant difference was found at P < 0.05

Mean and standard deviation of the debonding strength values (MPa) for the two groups assessed. Using independent sample t-test; no significant difference was found at P < 0.05