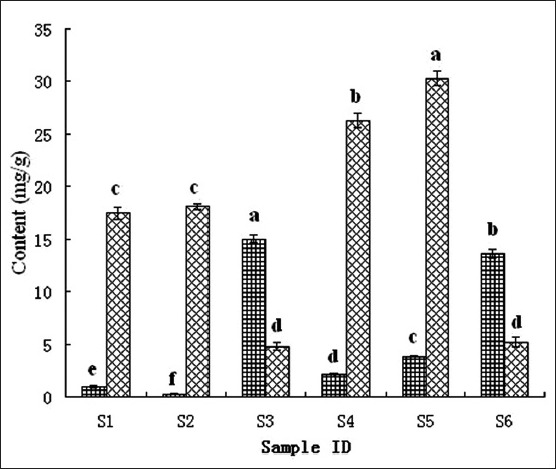
Fig. 2.

Rutin and quercetin concentration of tartary buckwheat tea.
Bar graph of rutin ( ) and quercetin (
 ). Values marked by the same letter are not significantly different (P<0.05).

Rutin and quercetin concentration of tartary buckwheat tea.
Bar graph of rutin ( ) and quercetin (
 ). Values marked by the same letter are not significantly different (P<0.05).