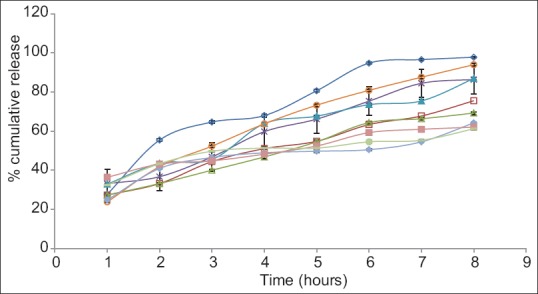
Fig. 1.

Dissolution profile of various batches of tablets.
Error bars represent standard deviation of n=3. C-300 (-◊-); H300 (-□-); H1:1 (-Δ-); H1:3 (-×-); H1:5 (-▲-); H1:7 (-○-); H3:1 (-♦-); H5:1 (-■-) and H7:1 (-●-).

Dissolution profile of various batches of tablets.
Error bars represent standard deviation of n=3. C-300 (-◊-); H300 (-□-); H1:1 (-Δ-); H1:3 (-×-); H1:5 (-▲-); H1:7 (-○-); H3:1 (-♦-); H5:1 (-■-) and H7:1 (-●-).