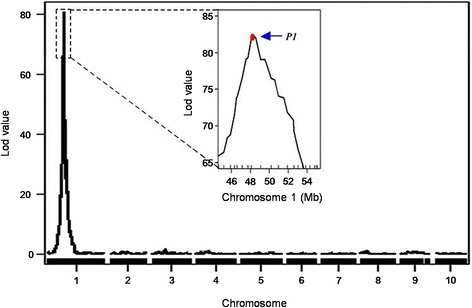
Fig. 3.

Mapping of P1, which controls cob color, in the RIL population. Curves in plot indicate the genetic coordinates along chromosomes or the physical coordinates within a chromosome (x-axis) and LOD score (y-axis) of the detected QTL. Mapping curve of the QTL that controls cob color of is located on chromosome 1; the box shows a magnification of the peak on chromosome 1. The red dot represents the relative physical position of the P1 gene
