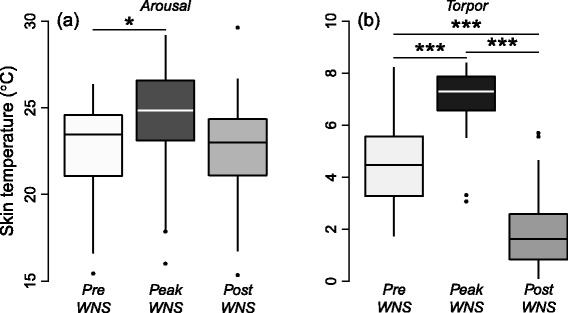
Fig. 2.

a The skin temperature during arousal bouts in in pre-WNS, peak-WNS and post-WNS bats. b Torpor skin temperature in pre-WNS, peak-WNS and post-WNS bats. For statistical details, see Table 2. The asterisks ***, **, and * indicate statistical significance of P < 0.001, P < 0.01, and P < 0.05, respectively. Boxes depict the 25th and 75th percentiles, lines within boxes mark the median, and whiskers represent 95th and the 5th percentiles
