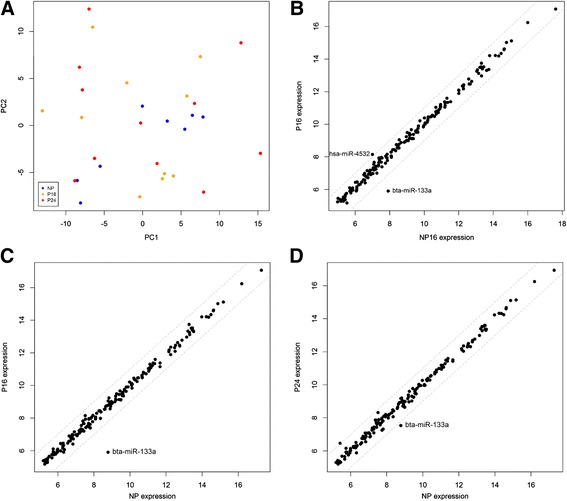
Fig. 3.

Results of differential expression analysis of miRNA sequencing data. a PCA plot using data from all pregnant (P16 and P24) and non-pregnant (NP) time-points obtained by Illumina small-RNA sequencing. Scatterplots for P16 vs NP16 (b) P16 vs NP (c) and P24 vs NP (d) comparisons using individual miRNA data are shown. The grey dotted lines indicate the 2-fold change threshold, and miRNAs which changed more than 2-fold between groups have been labelled. All data have been log2 transformed
