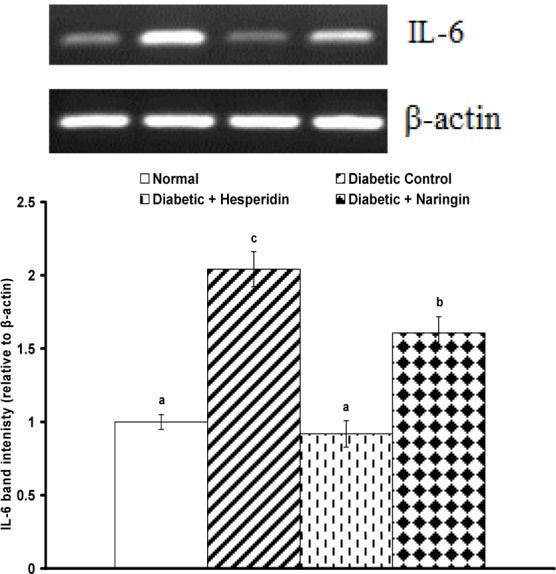
Figure 1. RT-PCR analysis of adipose tissue IL-6 and β-actin expression of normal, diabetic control and diabetic rats treated with hesperidin and naringin.

Top: Gel photograph depicting representative IL-6 and β-actin PCR products.
Bottom: Corresponding densitometric analysis of adipose IL-6 PCR products from 3 different experiments, represented as the IL-6 band intensity relative to β-actin.
