Fig. 5.

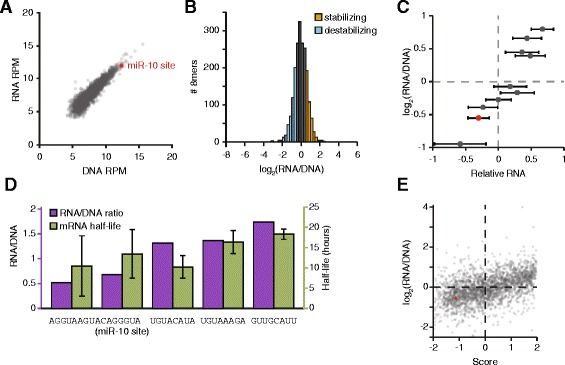
RNA levels for each sequence correlate to expression score. a The normalized read counts for each 8mer were found in DNA (x-axis) and RNA (y-axis) isolated from GFP-positive cells and gated within the middle 25 % of dsRed expression. The miR-10 target site is depicted in red. Pearson r = 0.916, p < 10−15. b Distribution of RNA/DNA ratios for all tested 8mers. 8mers with log2(RNA/DNA) > 0.5 are shown in orange, and < −0.5 in blue. c RNA abundance for ten control 8mers. RNA was isolated and quantified from ten cell lines in which expression control sequences were inserted into GFP and integrated in the genome. Shown is the mean of values normalized to that of UUCCGUUA. n = 2; error bars are propagated error from 3 technical replicates per biological replicate. Normalized RNA values (x-axis) for each 8mer are plotted versus the ratio of RNA/DNA determined in the screen. The miR-10 target site is depicted in red. Pearson r = 0.951, p < 104. d Transcript half-lives correlate with RNA/DNA ratios. Cell lines in which individual 8mers were integrated were used to find transcript half-lives. Data from 3–6 replicates were combined to find half-lives, error bars indicate standard deviation. Pearson r = 0.675. e The expression score (x-axis) and the RNA/DNA ratio (y-axis) are shown for each 8mer. The miR-10 target site is depicted in red. Pearson r = 0.464, p < 10−15
