
Fig. 4.
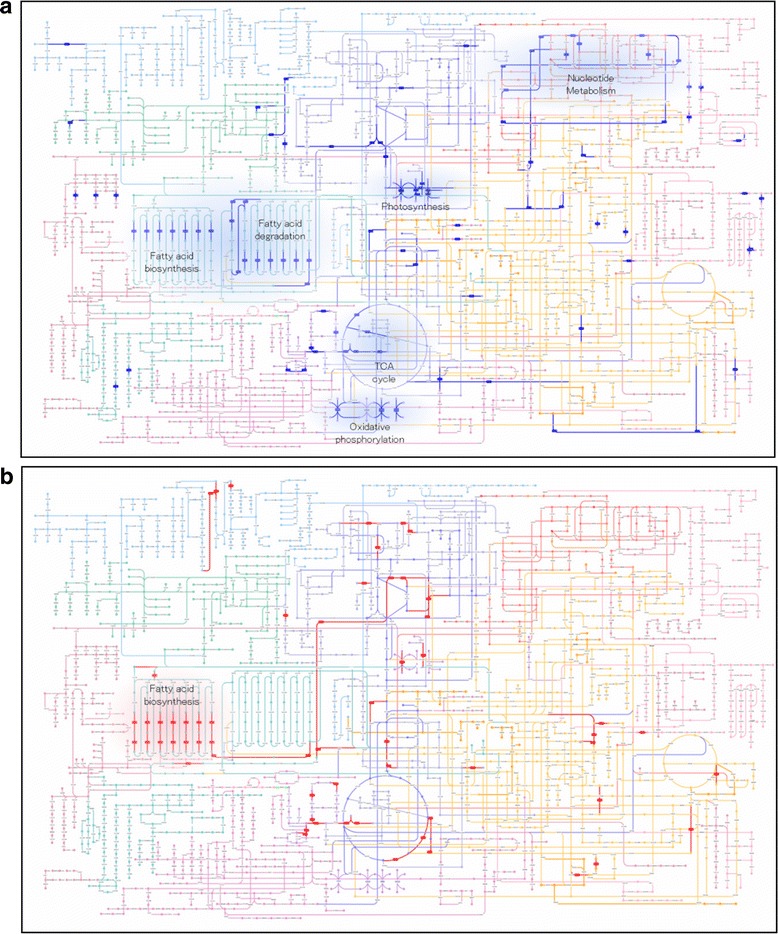
Representation of pathway maps for differential expressed genes in response to anaerobic treatment for 24 h. Given are values for FPKM ratios corresponding to components above the 2-fold change threshold. Blue (a) and red (b) colors highlight down- and up-regulated genes, respectively. Some genes related to pathways involving photosynthesis, nucleotide metabolism, TCA cycle, oxidative phosphorylation, fatty acid degradation, and a part of fatty acid biosynthesis showed lower expression in response to anaerobic treatment for 24 h. Zoomable interactive maps generated using Pathway Projector [39] are available online at: [Down-regulated pathways] http://ws.g-language.org/g4/main.cgi?diaAtabareaname=1&flag=00001, [Up-regulated pathways] http://ws.g-language.org/g4/main.cgi?diaAtabareaname=1&flag=00002