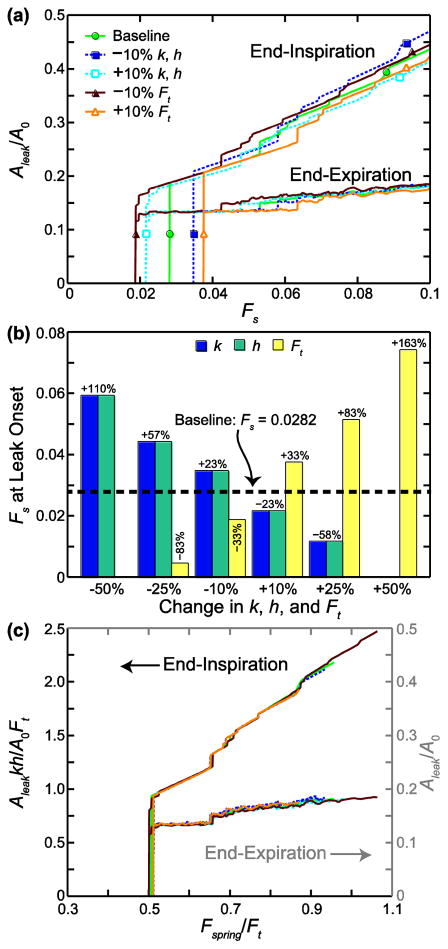
FIGURE 4.
Sensitivity to parameters k (stiffness), h (edge length), and Ft (force threshold) in 45-cell network. (a) Leak area, Aleak, normalized by the total network area before stretching and cell–cell junction failure, A0, is plotted against the stretch force Fs. (b) Change in Fs at leak onset from the baseline case is shown for ±10%, ±25%, and ±50% changes in k, h, and Ft. For a 50% decrease in Ft and a 50% increase in k or h, all values of Fs formed a leak. (c) All cases are plotted on nondimensional axes, with the end-inspiration curves following the left-hand axis and the end-expiration curves following the right-hand axis. Fspring is the maximum internal spring force in the network before cell–cell junction failures occur.

