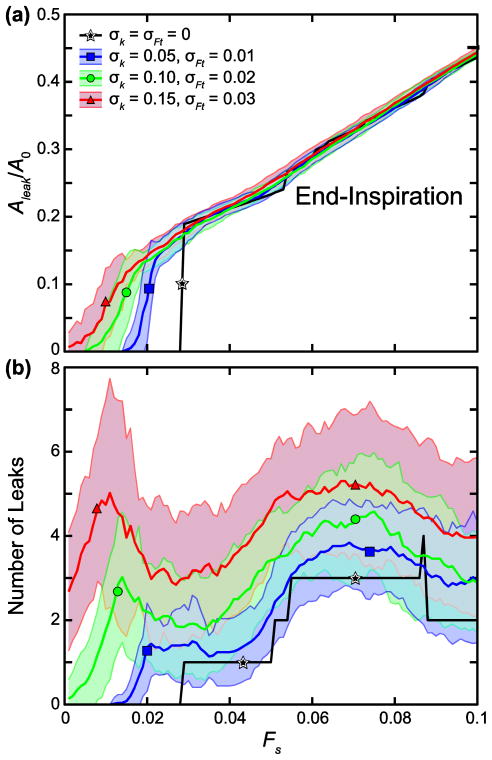
FIGURE 6.
Sensitivity to inhomogeneous k (stiffness) and Ft (force threshold) in 45-cell network. (a) Mean leak area, Aleak, normalized by the total network area before stretching and cell–cell junction failure, A0 and (b) mean number of leaks are plotted with increasing stretch force, Fs. Shading represents standard deviation bounds (n = 50). k and Ft were chosen from normal distributions with μk = 1 and σk =0.05, 0.1, and 0.15 and μFt = 0.2 and σFt = 0.01, 0.02, 0.03, respectively.

