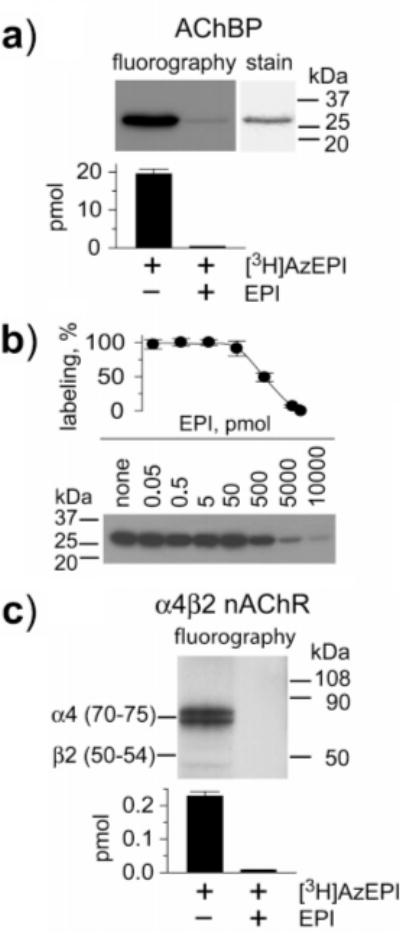
FIGURE 2.

[3H]AzEPI photoaffinity labeling of AChBP and α4β2 nAChR. (a) Fluorography of [3H]AzEPI-labeled AChBP compared with Coomassie blue-stained protein and quantification by scintillation counting (bar graph with SD of three experiments). AChBP (76 pmol sites) was photoaffinity labeled by [3H]AzEPI (92 pmol) alone (−) and protected with EPI (10000 pmol) (+). (b) Quantification for protection of photoaffinity labeling of AChBP by EPI. AChBP (38 pmol sites) was reacted with [3H]AzEPI (46 pmol). The titration curve is plotted by radioactivity determination for the protein band as above in separate experiments from the fluorography image. (c) The α4β2 receptor (10 pmol sites) was subjected to photoaffinity labeling by [3H]AzEPI (20 pmol) in the absence (−) and the presence (+) of EPI (10000 pmol). Fluorography shows exclusive labeling of the α4 subunit. Photoincorporation is defined by radioactivity in the corresponding region on the SDS–PAGE, and the labeled amount is the summation of the doublet which is due to different states of glycosylation (25).
