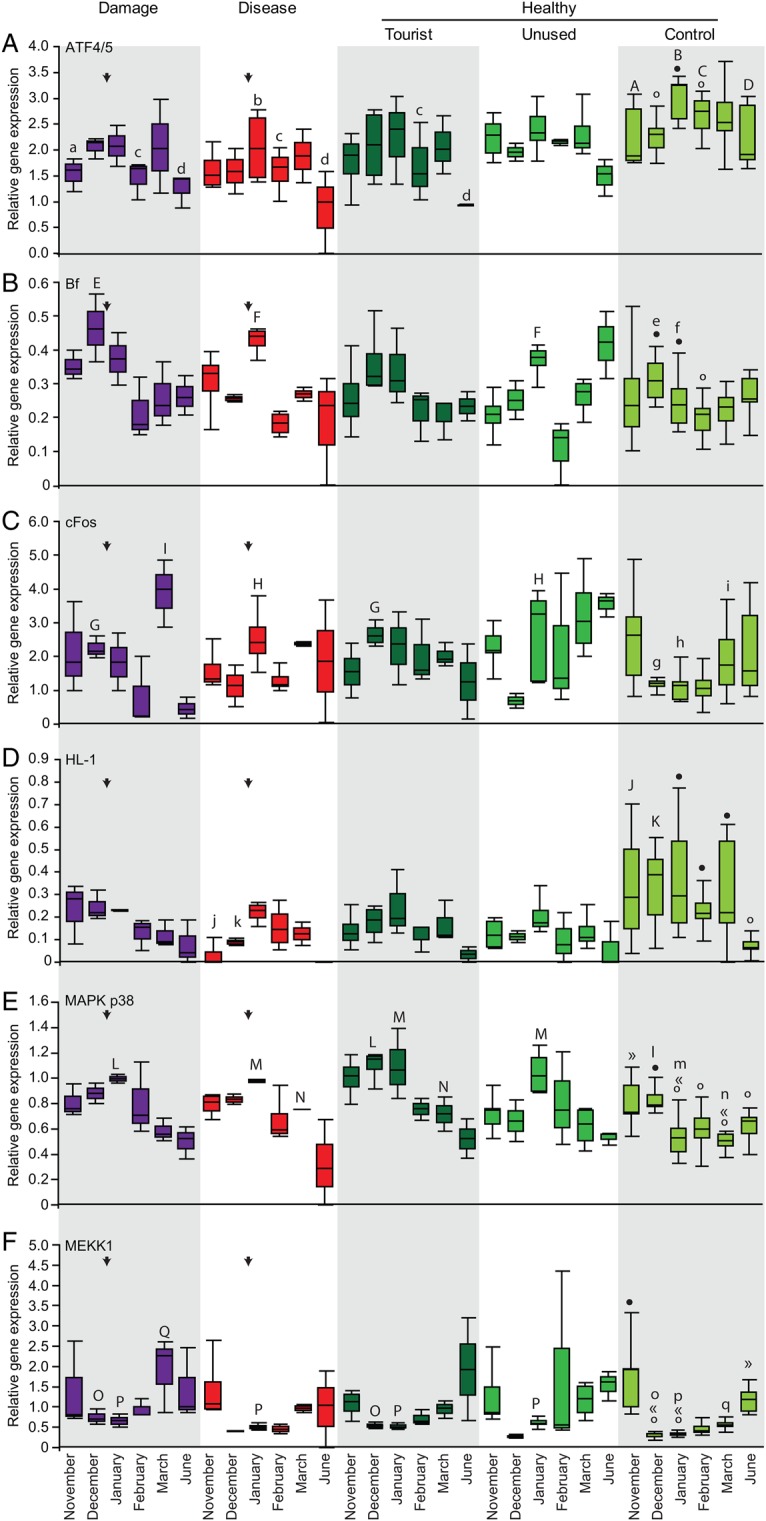
Figure 3:

Comparative temporal patterns in immune gene expression levels in A. millepora at Hardy Reef, central Great Barrier Reef. Patterns are compared among corals that were healthy at three study sites (tourist platform, unused platform and control site) and those that were damaged or diseased at platform sites, for ATF4/5 (A), Bf (B), cFos (C), HL-1 (D), MAPK p38 (E) and MEKK1 (F). Data are grouped by health status, with healthy corals split up by study location. Arrows indicate when disease and damage occurred. Letters indicate means that differ significantly from the corresponding mean at the control site, where upper case letters (A–Q) denote the significantly higher mean in the comparison and lower case letters (a–q) denote the significantly lower mean. For temporal patterns in control corals, symbols (filled and open circles, or « and ») denote means that differ significantly from means with the other symbol. Results were considered significant when P < 0.05 or 95% confidence interval excluded zero.
