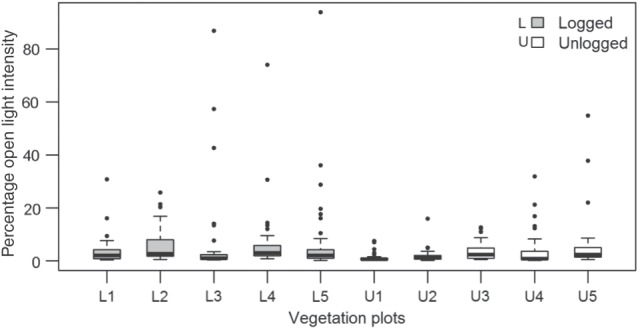
Figure 1:

Percentage open light intensity for logged (L1–L5) and unlogged plots (U1–U5) in Kibale National Park (KNP), Uganda. Each vegetation plot has 42 light-intensity measurements. Each boxplot shows the median (black horizontal line), the upper quartile (space above black line), the lower quartile (space below black line), minimum (lower whisker) and maximum values (upper whisker) and extreme values or outliers (filled circles). Mean percentage open light intensity was significantly higher in logged plots (Student's unpaired t = 2.92, P < 0.05).
