
Figure 3:
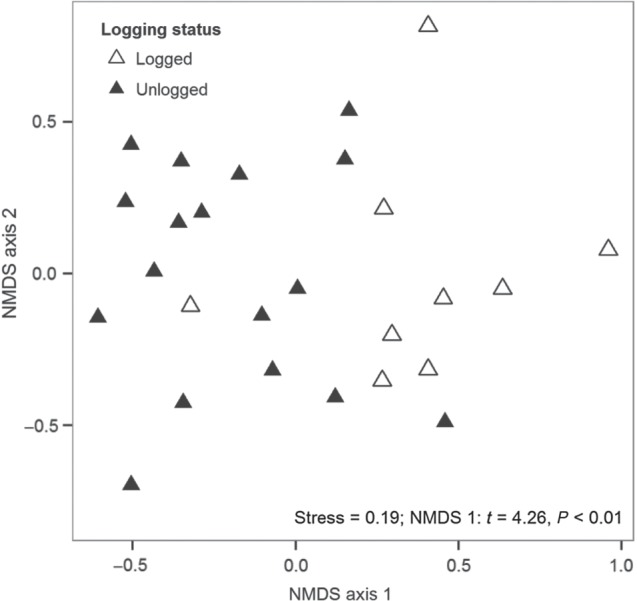
Ordination of taxonomic composition of logged (n = 9) and unlogged (n = 17) plots in KNP. The non-metric multidimensional scaling produced two axes (NMDS1 and NMDS2). Logged plots (open triangles) differed significantly from unlogged plots (filled triangles) in species composition along the first axis (t = 4. 26, P < 0.01) based on a Student's unpaired t-test, with most logged plots loading positively on axis 1.