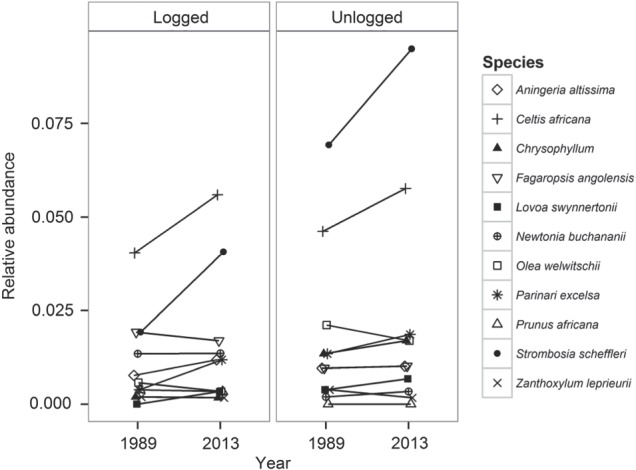
Figure 4:

Trends in relative abundances of 11 tree species commercially logged in KNP, based on their relative abundances in 1989 and 2013 in logged and unlogged plots. Each species is represented by a different symbol, while lines connect symbols to show trends between relative abundance in 1989 and 2013 for each species.
