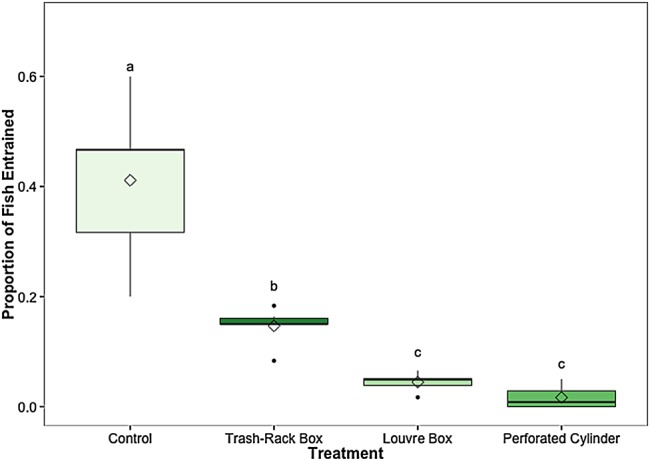
Figure 2:

The proportion of fish that were entrained through the diversion pipe out of the total number of fish tested for each treatment. Different lowercase letters indicate statistically significant differences among treatments. Black line represents the median, box the interquartile range (IQR), whiskers = 1.5 IQR, filled circles represent outliers, and diamond indicates the mean. Mean proportions of fish diverted for each treatment (±SEM) are reported in the text. n = 6 trials for each treatment, 60 (±3) fish per trial.
