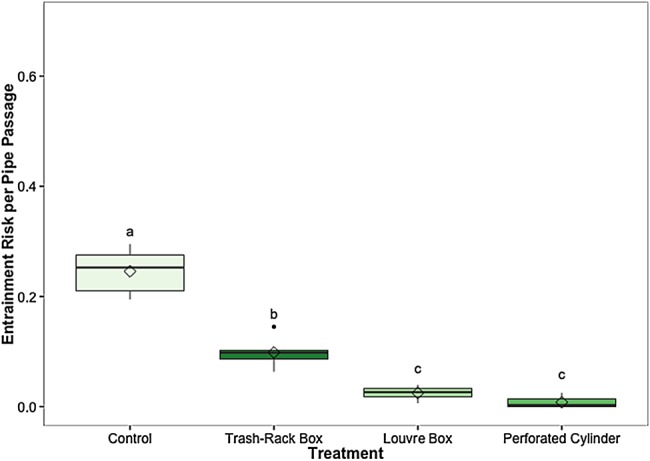
Figure 3:

The entrainment risk per pipe passage for each treatment condition. This represents the chance of a fish becoming entrained into the diversion pipe after swimming past the pipe a single time. Different lowercase letters indicate statistically significant differences among treatments. Black line represents the median, box the interquartile range (IQR), whiskers = 1.5 IQR, filled circles represent outliers, and diamond indicates the mean. Mean proportions of fish diverted for each treatment (±SEM) are reported in the text. n = 6 trials for each treatment, 60 (±3) fish per trial.
