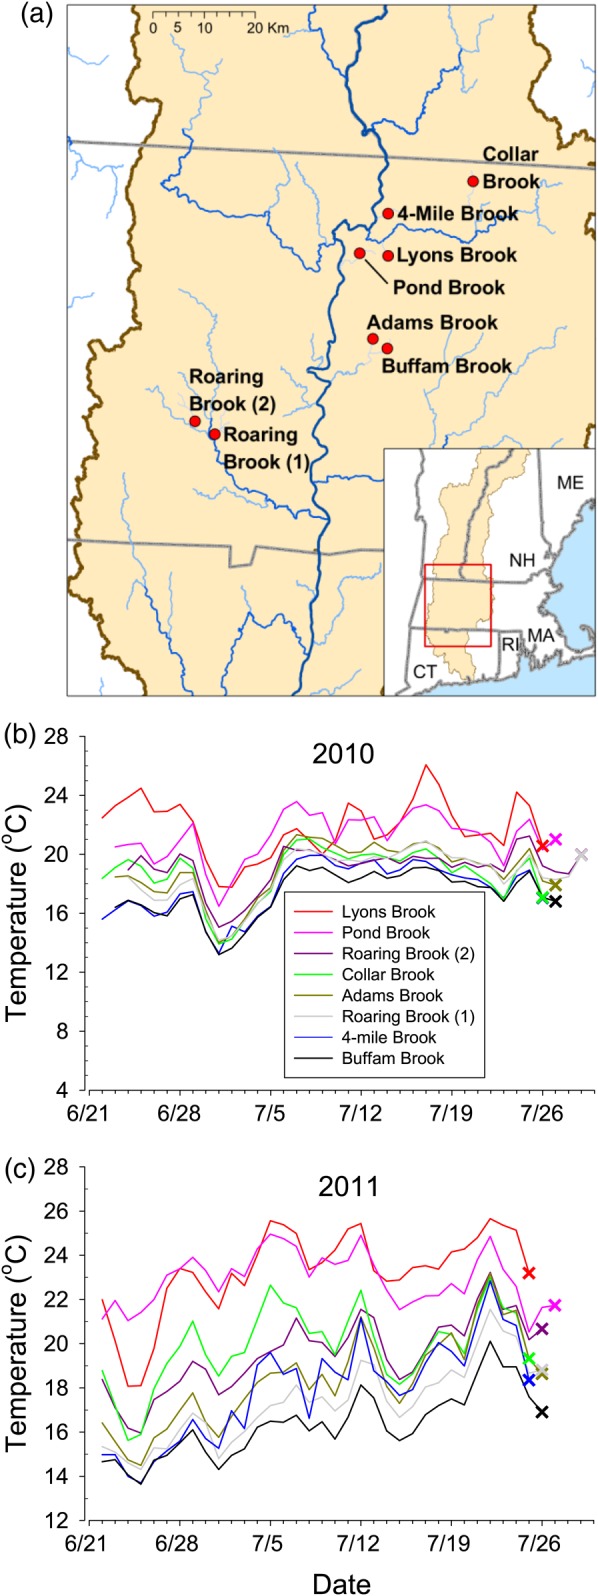
Figure 2:

Location (a) and temperature profiles of our eight field sites (b, c). The daily mean water temperature of our field sites was measured in summer 2010 (b) and summer 2011 (c) during the month preceding sampling. The date when each site was sampled is marked by an X.
