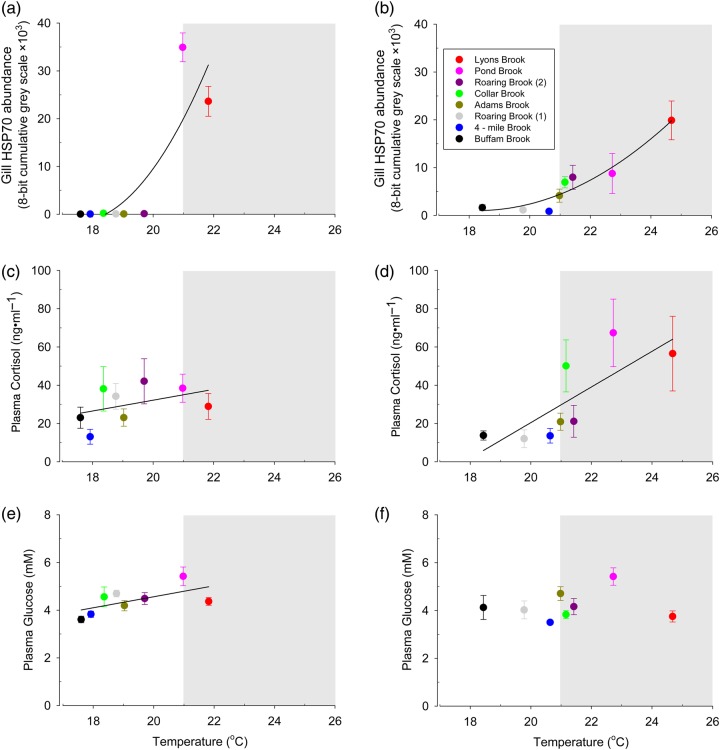
Figure 3:
Effect of temperature on the gill HSP70 (a, b), plasma cortisol (c, d) and plasma glucose (e, f) in wild brook trout from streams samples in 2010 (a, c, e) and 2011 (b, d, f). Points represent means ± SEM (n = 6–12). Quadratic (a, b) and linear regressions (c–f) were used to analyse the data. The mean temperature from the 7 days before sampling was used as a predictor variable.

