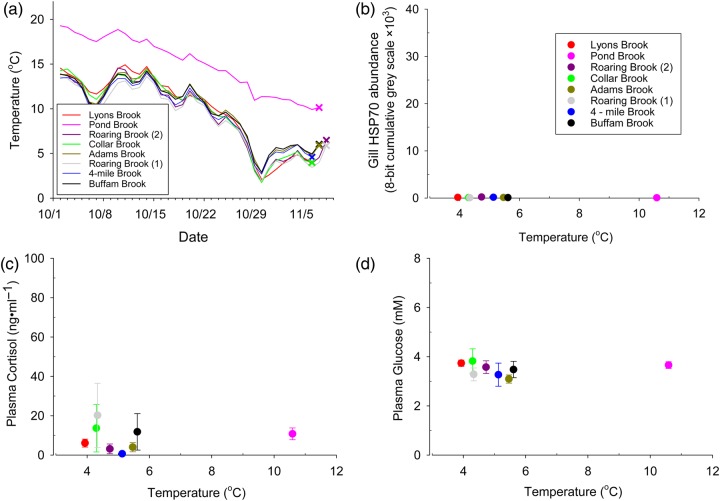
Figure 5:
Effect of temperature on gill HSP70 (a), plasma cortisol (b) and plasma glucose (c) in wild brook trout in autumn 2011. Points represent means ± SEM (n = 6–10). Quadratic (a) and linear regressions (b, c) were used to analyse the data. The mean temperature from the 7 days before sampling was used as a predictor variable.

